Arc Diagram
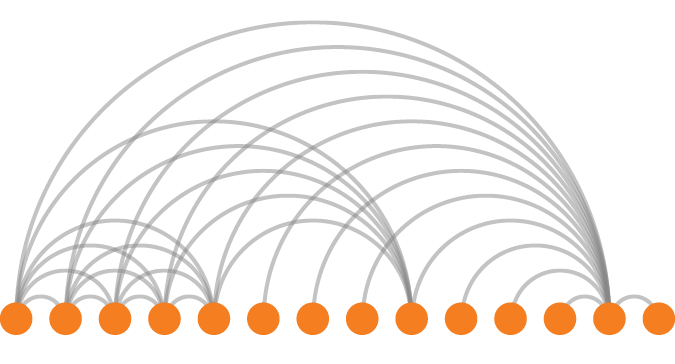
Arc diagrams are a method for representing network connections. Nodes of the network are displayed along a single axis (usually the horizontal axis) while the connections between them are displayed using arcs. Arc thickness can also be used to represent frequency between the source and node, enabling comparisons and finding co-occurrence between links.
Arc diagrams can provide interrelated data, making it easy to identify clusters and relationships between links. Simple layout also makes it possible to display multivariate data alongside the nodes.
Arc diagrams can become cluttered and difficult to interpret when the data consists of a large number of connections.
In a complex layout with many overlapping connections, the one dimensional layout may not show connections between nodes as clearly as two dimensional charts.