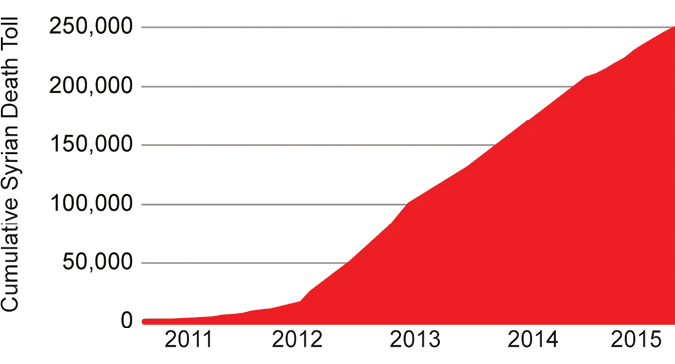
Area Graph

Area graphs display quantitative data over a continuous period of time, in a manner similar to the line graph. In an area graph however, the space below the line is filled with a particular color or texture. Area graphs are created by plotting data points on a grid (time is usually on the x-axis, with values on the y-axis), after which the points are connected with a line and the space below filled. Multiple data sets can be plot on the same chart for comparisons, using different fill colors or textures for each. Area graphs can show trending quantities, or even be used to compare the multiple quantities against each other.
See line charts or stacked area charts for comparing more than one quantity.
Image source: "Iconic photographs and the ebb and flow of empathic response to humanitarian disasters", Paul Slovic et al