Pictogram Chart
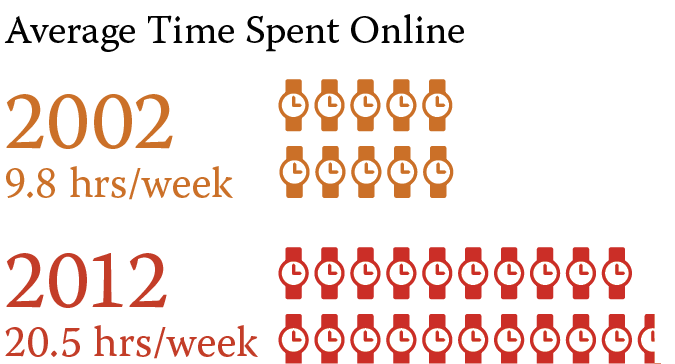
Pictogram charts use small icons to display the data, with each icon representing a certain value or category.
Icons are usually related to the data represented, making it easy to interpret, though annotation or a legend should explain the icon.
For example, a pictogram can be used to display the number of houses in different areas, with small icons of houses used to represent the quantity. Each house may represent a single unit or a number of units (as specified in the legend).
Pictograms add a level of visual narrative that may be useful when communicating across language or cultural barriers.
Adding too many different types of icons can quickly get confusing.
Image source: Internet usage in China, the Committee to Protect Journalists, John Emerson