Radar Chart
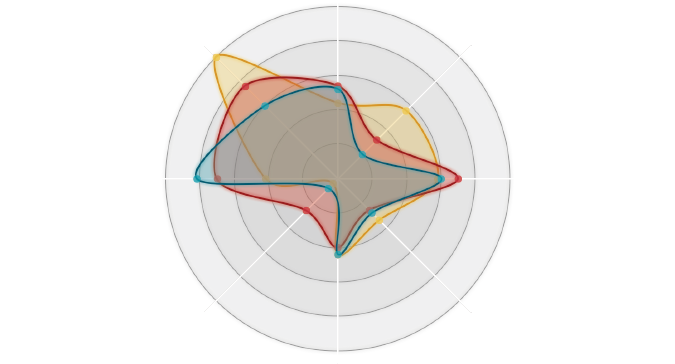
Radar charts display and compare multiple quantitative variables. The variables are provided axes, each of which may have a different scale, and are arranged in a circular form. The chart is ideal for measuring 3-8 variables, as it becomes difficult to read as more axes are included. Data points are plotted along their individual axes, with lines connecting the points to form a polygon. Multiple data sets can be plot against the same chart, with each being marked a different color.
Image source: Nadiah Bremer