Bubble Map
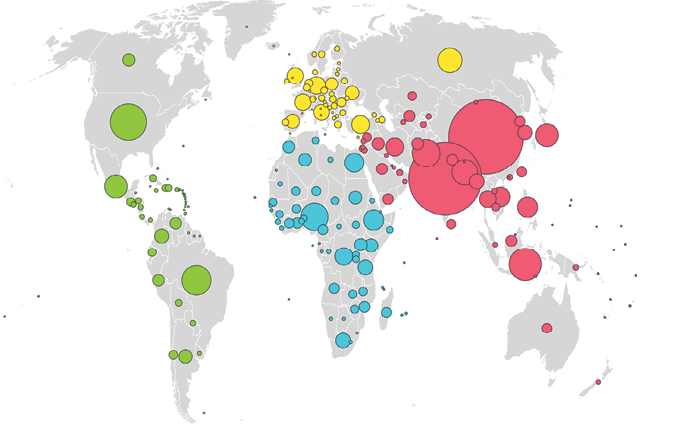
Bubble maps are useful for comparing proportions and amounts against geography. Bubble maps are a variation of a bubble chart, with bubbles plotted over geographical regions rather than the traditional Cartesian plane. The size or area of the bubble indicates the value of the particular variable, with the position on the map indicating location. The bubble map is effective when the effect of location on a particular variable is to be analyzed and comparisons need to be made. Plotting the number of projects, amount spent, or amount received on a bubble map can provide useful insights regarding where the organization must focus future efforts, for example.
Bubble maps can become confusing, however, if very large bubbles overlap on the map. Comparing the scale of bubbles may also be difficult, but grouping data ranges into specific sized bubbles may help.
Image source: Gapminder