Sunburst Diagram
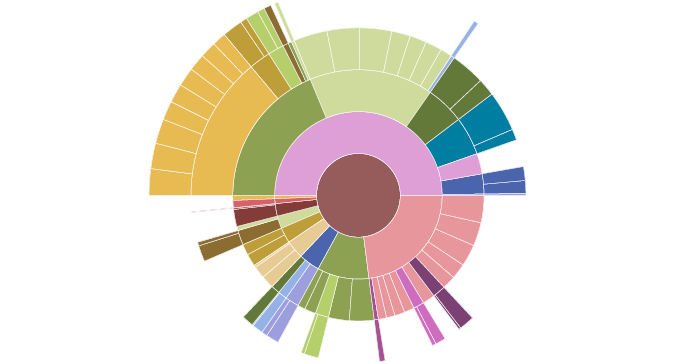
Sunburst diagrams are also known as ring charts or multi-level pie charts. The diagram shows hierarchical relationships through a series of rings moving outwards with each level of hierarchy. The rings of a sunburst diagram are slices to represent sub-categories within each level. The central circle represents the "root node," with each slice extending from the central circle a "child node," representing a part-to-whole relationship. The slices of the rings can be either split equally, or be split proportionate to value in order to represent a quantitative variable. Colors can be added to the diagram to categorize variables or to group variables. It is possible for one slice in a ring to have further "child nodes," giving the chart an uneven appearance.
Image source: Mike Bostock