Flow Chart
A flow chart, or work flow diagram, outlines the sequential steps of a defined process. Flow charts can effectively simplify complex or abstract procedures for communication.
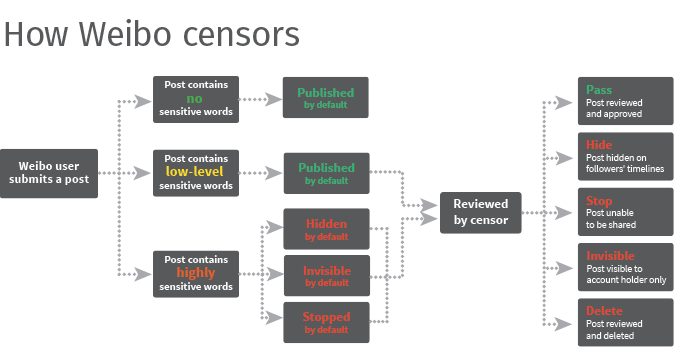
The process is mapped out using connected symbols, such as arrows, indicating the direction of the next step. Boxes around steps sometimes use different shapes to differentiate the type of step. For instance: rectangles (process step), curved rectangles (start or end of process), diamonds (decision point), etc. These symbols are standardized in order to make interpretation of these charts easier. Details of each step are written within the symbols to clarify and explain the process. Flow charts can be used in either the planning/design phase of a process, or to explain an existing process to others. An example of a flow chart would be a chart outlining the steps to be taken for opening of a new bank account or registering a new customer. Flowcharts can become complicated if not structured logically or if arrows overlap.
Image source: The Committee to Protect Journalists, John Emerson