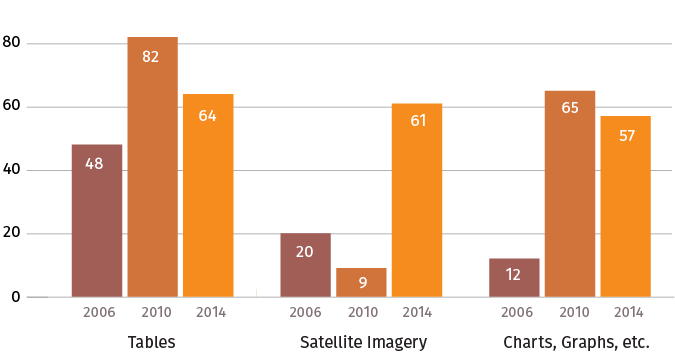
Multi-Set Bar Chart

Multi-set bar charts, also known as clustered bar charts, are a variation of a bar chart where two or more data sets are plotted side by side along a common axis. These are used to compare variables within the same category, and thus provide more information than a simple bar chart. The bars for each variable are shaded a different color, and a small space is given between categories to make the graph easy to read.
Bar charts are useful for comparisons among data sets or grouped variables within the same category type, though can become difficult to read if too many bars are used in a single group.