Line Graph
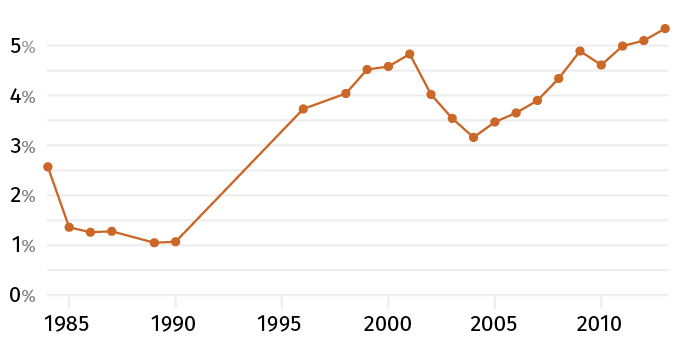
Line graphs are used to compare two variables, with one variable along the x-axis and another along the y-axis. While line graphs can be used to represent any two variables, they are commonly used to represent a change in one variable over a continuous period of time—for example, to show changes in quantity or percentage against time.
In addition to trends, line graphs can illustrate correlations between two variables, and how one changes with the other.
Multiple data sets can be compared using a line graph by plotting them on the same chart using different colored lines.
Too many data sets on a line graph can make it difficult to read due to clutter. Data sets with similar values cannot be easily distinguished in a line chart and may be compared more effectively using a clustered bar chart.