Gantt Chart
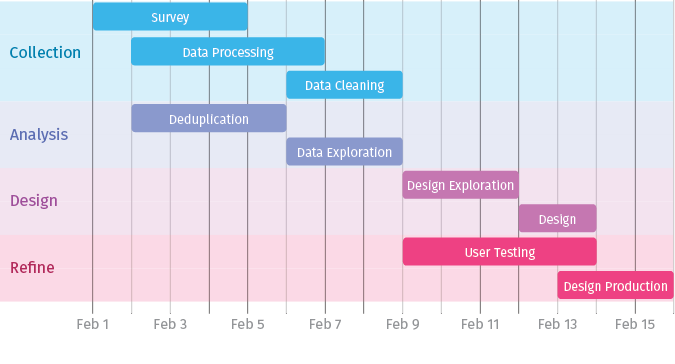
A Gantt chart is a kind of timeline that show bars extending horizontally to illustrate duration, with the different categories of task arranged vertically.
Gantt charts are a way of illustrating simultaneous timelines, as well as parts of an overall timeline.
Gantt charts are often used in project management to illustrate dependencies among smaller tasks that are part of the larger overall project goal.
Image source: Jess Peter