Proportional Area
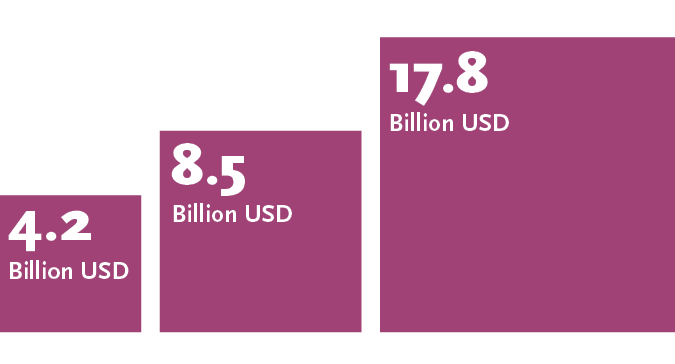
A proportional area chart uses shapes to compare qualitative data through the relative size of each shape. Common shapes used are squares, rectangles. or circles, as they are easy for the human eye to compare. Multiple data sets can also be plot on the same area chart in order to represent sub-categories and provide further detail about the data.
Proportional area charts can communicate a "big picture" overview and relative differences between areas, but are hard to read with precision.