Timeline
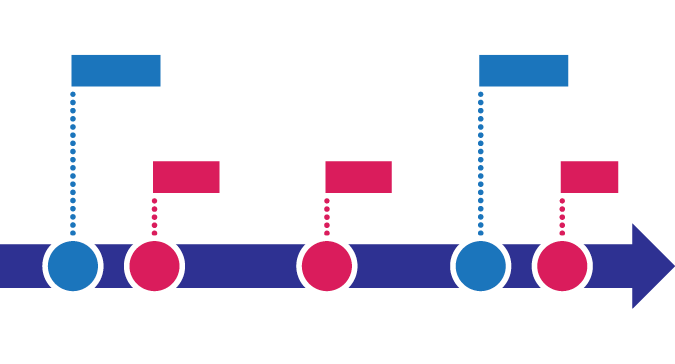
Timelines display events in sequential order. Timelines are suitable to display any quantitative or qualitative information related to time. They are especially effective in communicating a story, visualizing history, or analyzing a sequence of events. Timelines may be scaled to show equal gaps between equal periods of time, or may act as a simple list of events in chronological order. Timelines can be combined with a graph to effectively show quantitative data over time.
Some interactive timelines allow the user to zoom in and out of dense clusters of data for a finer grained view.
It has become a convention for timelines to move from left to right, though vertical timelines work particularly well on the web. Radial timelines may be suitable for visualizing daily, seasonal, or other cyclical patterns of data.