Box & Whisker Plot
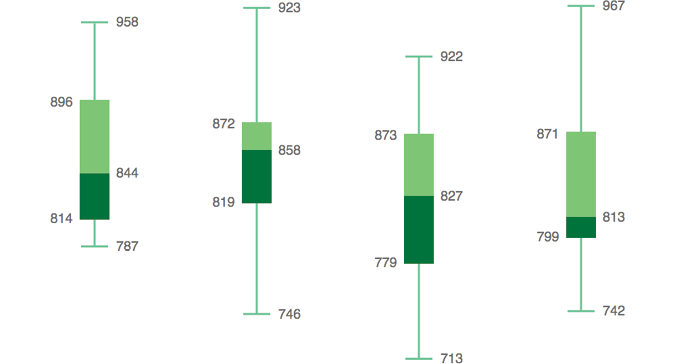
The box and whisker plot (also known as box plot) contains a 5-point summary of data points: the upper extreme, upper quartile, median, lower quartile, and lower extreme values. Through these five values, the box plot provides information regarding the variability and skewness of the distribution. The "box" shows the median, and the two quartiles, with two lines extending from both sides (the "whiskers") indicating the variability outside the quartiles. Multiple box plots can be drawn alongside each other to compare data sets. Box plots can be used to analyze the distributions over time, indicating changes in median values, variability in amounts, etc.