Flow Map
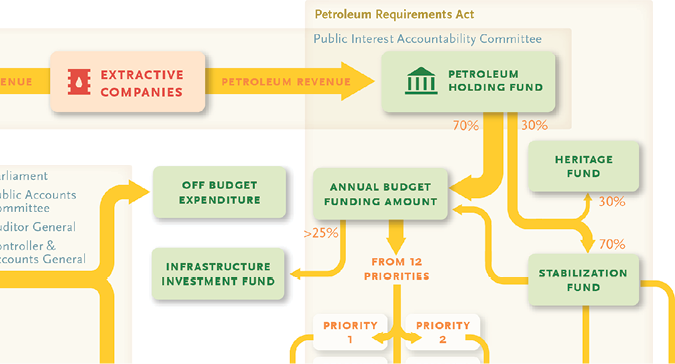
Flow maps are a combination of flow charts and maps showing the movement of information or objects from one location to another. Arrows are used to represent the direction of movement from the point of origin, with the thickness of the arrow representing the quantity of the movement. An example of a flow map would be a map showing migration patterns, trade patterns, or even the flow of technology and ideas. Different colored arrows can be used on the same map to categorize the type of flow, and show movement of people and objects on a single map. However, it would not be advisable to combine too many variables on a single diagram.
Flow maps use the familiar arrow metaphor to communicate, though many arrows or overlapping of arrows may create confusion.