Network Diagram
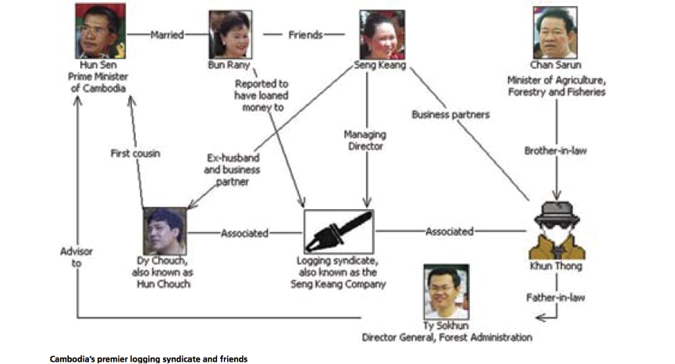
Network diagrams visualize interconnections and relationships. They highlight interconnections between entities through the use of nodes and lines. Nodes are often drawn as circles, with links displayed as straight lines connecting the nodes. However, different icons and symbols can be used to represent different types of nodes. The length or thickness of the line, or the size of the node, can be used to represent additional information about the connection if required. Furthermore, the lines may have arrows indicating direction, or may be a simple line ("directed" or "undirected" network diagrams respectively). Labeling is often required in order to clarify details if these additional variables are added to the diagram. Network diagrams can be used to show alliances, networks of corruption, or other social networks. Network diagrams can provide insights regarding structure and cluster patterns of network and can help identify the problem if there is a breakdown somewhere in the network. Network diagrams can become cluttered and hard to read as the number of connections and nodes increases.
Image source: Cambodia's Family Trees. Global Witness