Error Bars
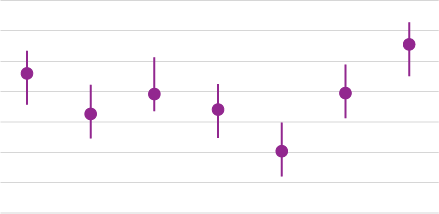
Error bars are indicators used in combination with other chart types (such as scatter plots, bar charts, or line charts) in order to display additional information. Error bars use small capped lines drawn over the original graph (from the center of a data point, parallel to the axis), showing the variability of the data point. The overall length of the line indicates how uncertain the data point is, and the length on each side shows if the data is skewed. (The data is skewed if length on both sides is unequal.) A shorter error bar indicates the data is more reliable, while a longer error bar indicates higher variability and thus less reliability.
Error bars may contain some ambiguity as the measurement of error is not standardized (it may measure standard deviation, standard error, confidence interval, etc.)