Dot Map
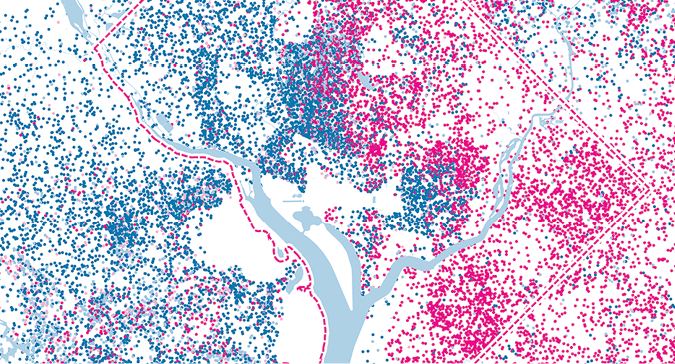
A dot map, also known as a dot distribution map or a dot density map, uses dots (or any other small shape) to mark the distribution of data over a geographical region. The point may represent a single unit, or may be keyed to represent multiple units. Differently sized points can also be used to indicate higher/lower frequency in an area, provided a legend is shown. Different shapes can also be used on a single map to indicate additional information.
Dot maps can provide useful information based on the pattern of clusters formed. Overlapping points may make the map difficult to read.
Image source: map of households by race in Washington DC from Sight Lines, Lize Mogel and John Emerson