Venn Diagram
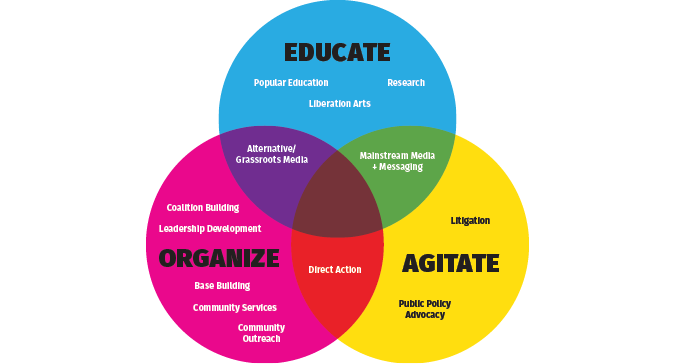
Venn diagrams, or set diagrams are useful for the visualization of relationships between sets. Venn diagrams often use circles to represent sets, with overlapping of circles to show data that is in common between the sets. This area of overlap is known as the area of intersection. The sets can be any collection of objects or data. The size of the circle can be used to show the proportional size of each data set as added information, along with text labels and different colors for different sets. Venn diagrams can effectively be used to show relationships between multiple sets, though can become complicated if too many sets are used in a single diagram
Image source: John Emerson