Histogram
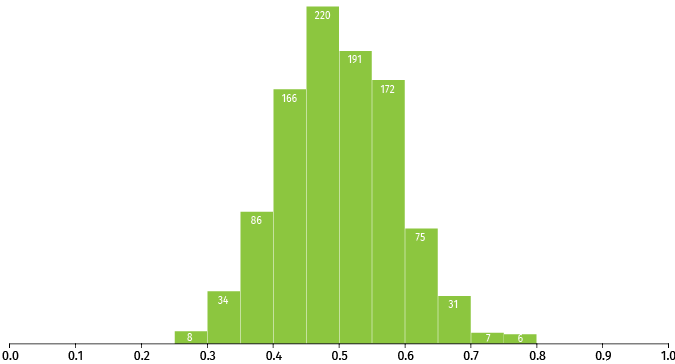
A histogram provides a visualization of the distribution of data over a specific period. Intervals or "bins" are defined, with a count of the data falling within each interval plotted on the graph. Each bar thus represents the frequency of the data within the interval. A histogram is a useful tool to identify where values are concentrated, or if there are extreme values or gaps in the data.
An example of using a histogram would be to display the number of people who have made donations, against buckets of donation size over a specific period of time. This would show how donors are distributed—whether there are few donors who donate large sums, or if donations are evenly distributed.
Histograms provide a clear visual representation of the distribution of data, and can provide a rough view of the probability distribution.
Histograms can be used only with continuous data.