Chart Types
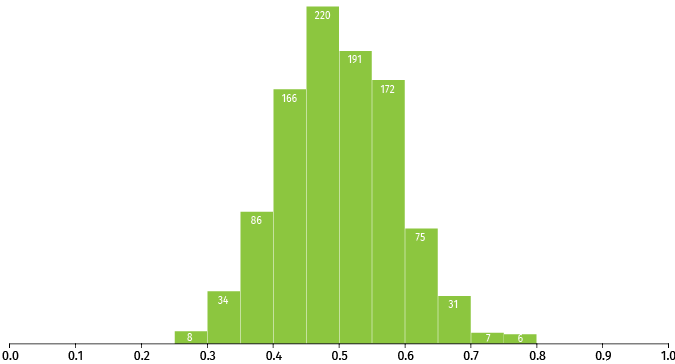
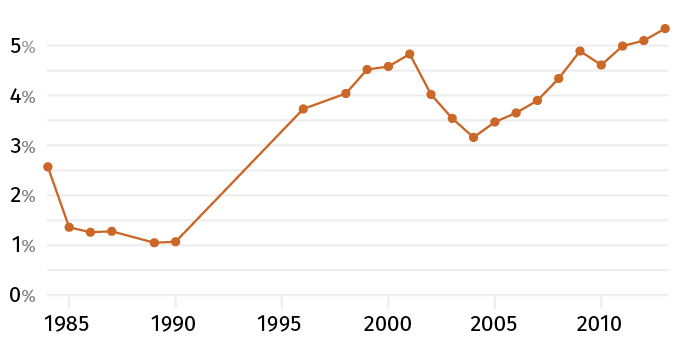
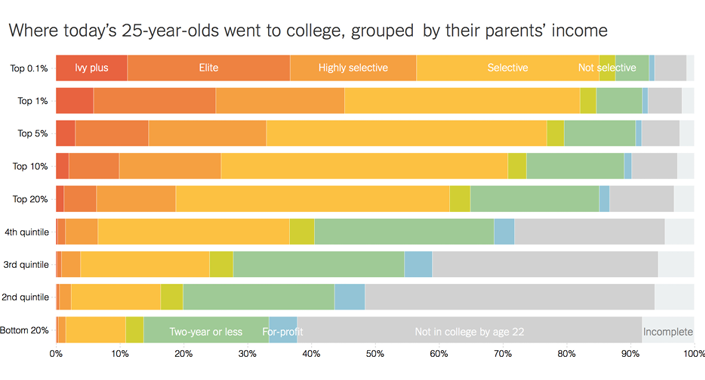
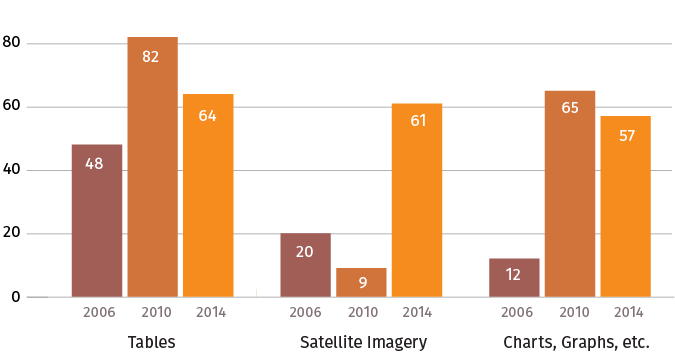
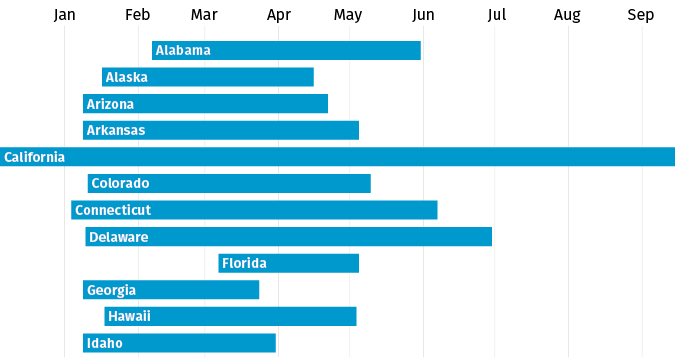
What are some chart types that best answer the questions you posed in step 3? Which charts are best suited to the kind of data you are using (continuous, categorical, discrete counts, etc.)?
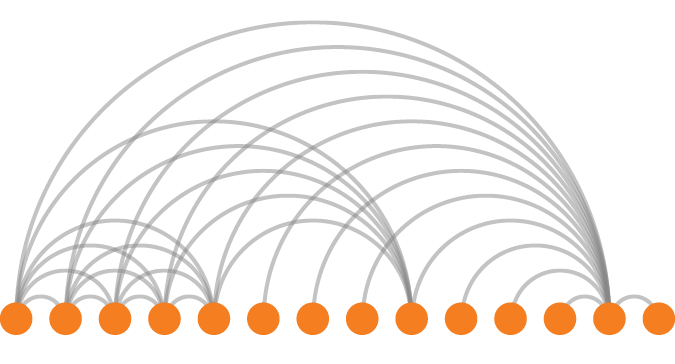
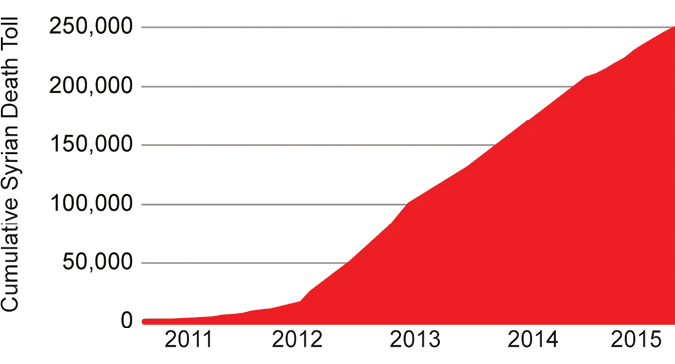
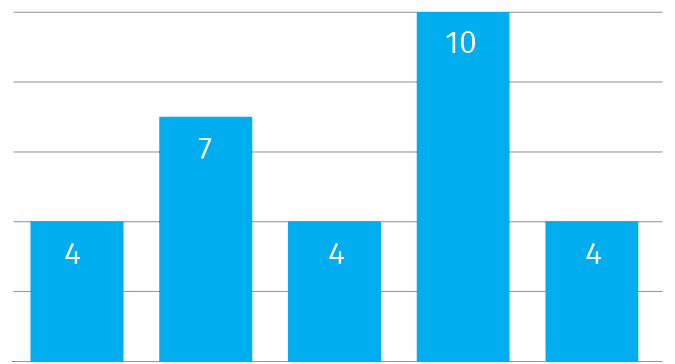
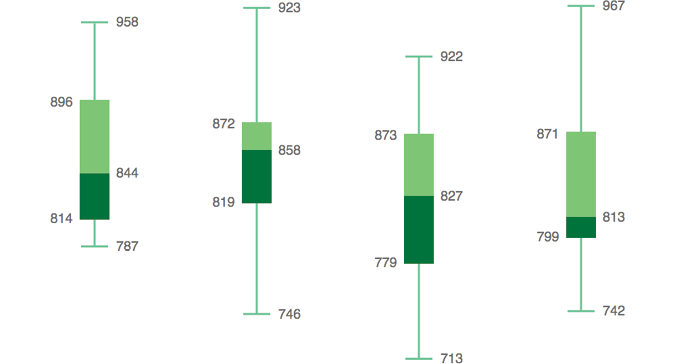
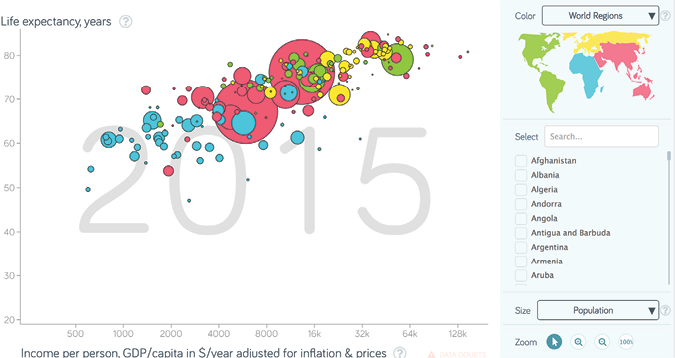
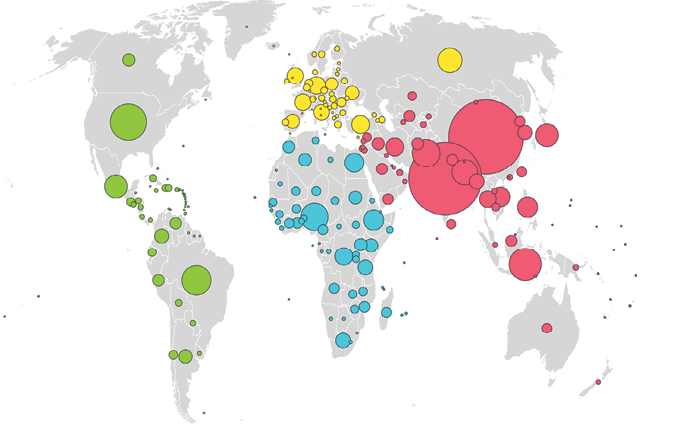
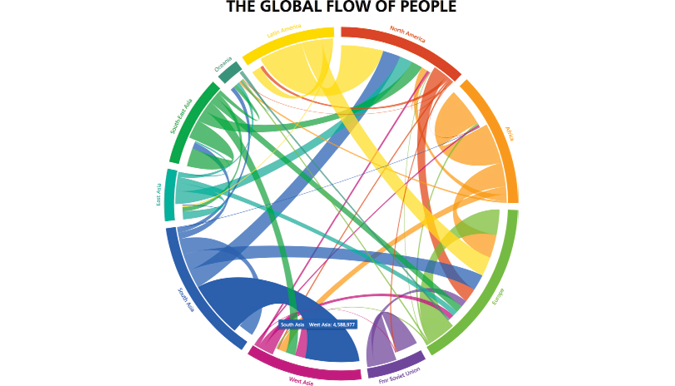
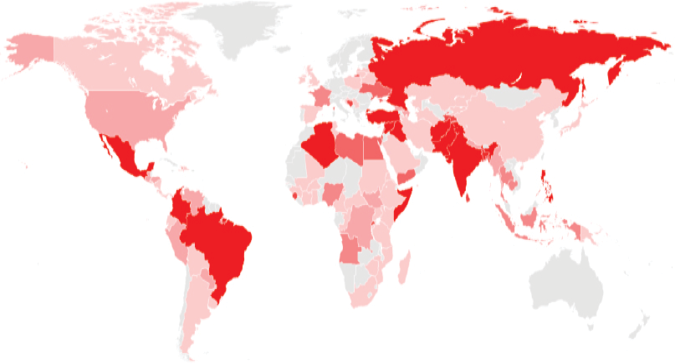
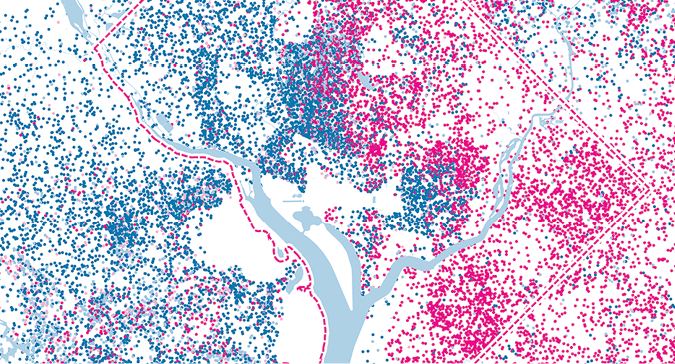
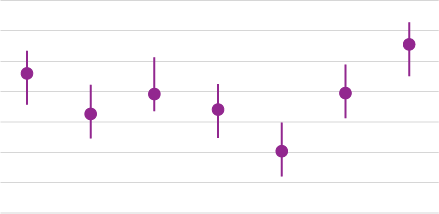
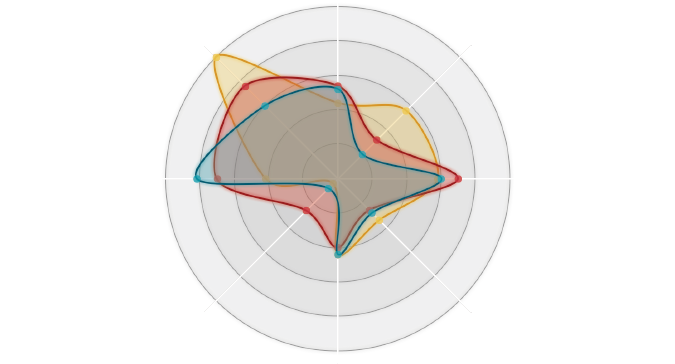
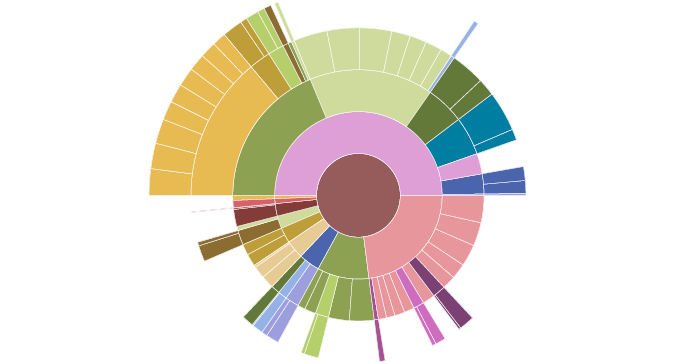
Data visualizations are created using visual encoding to associate an aspect of the data with a visual characteristic like position, color hue or value, size, shape, orientation, etc.
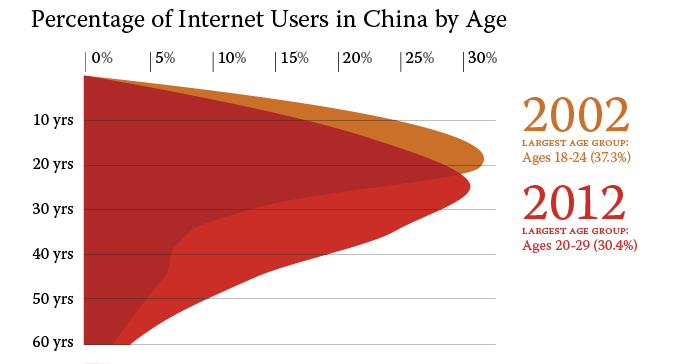
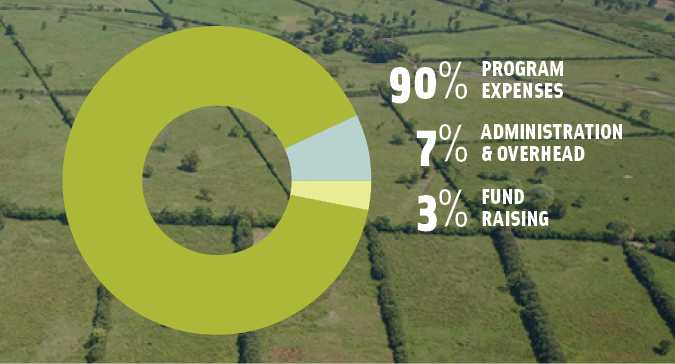
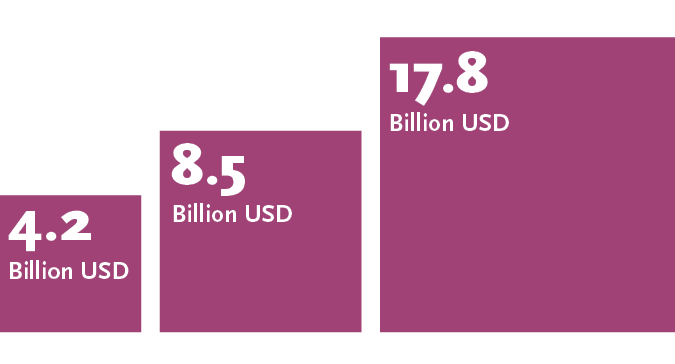
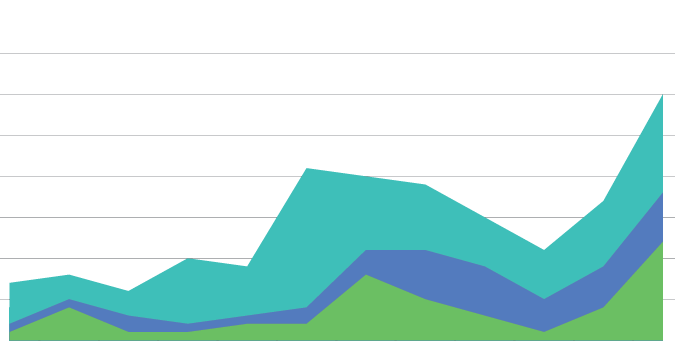
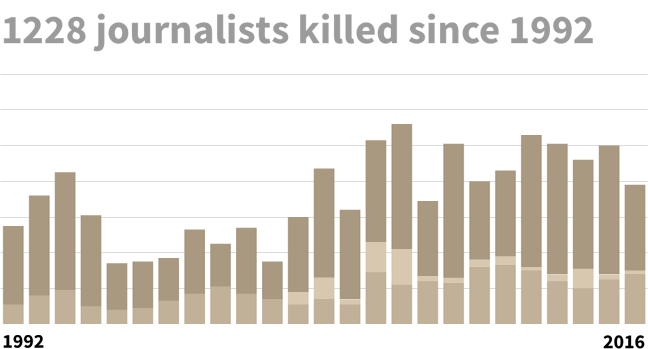
Visual metaphors and physical associations can also help interpret the data. For instance, similarity may be expressed as proximity, and larger amounts expressed as greater height or greater size.
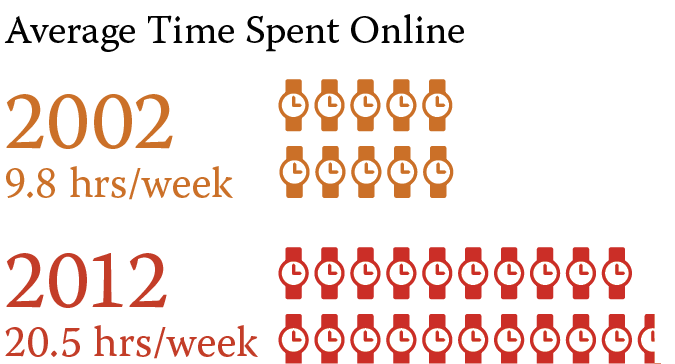
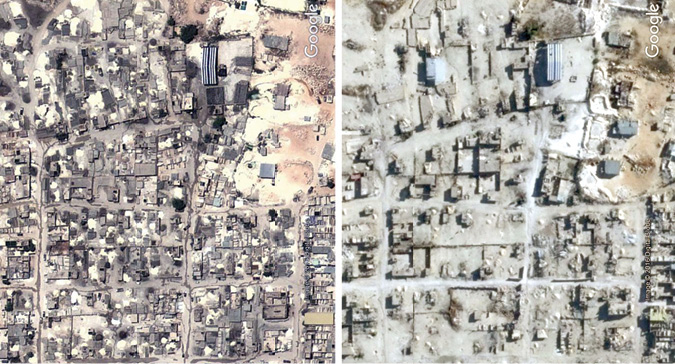
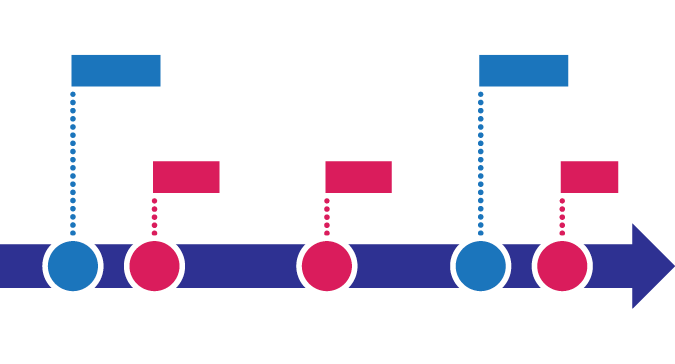
In some cases icons, pictograms, or other kinds of illustration can help express the phenomenon or make a chart memorable.
We have included a variety of chart types in this exercise and some will be more familiar than others. We encourage you to explore.
For additional visualization types, visit The Data Visualisation Catalogue.