Span Chart
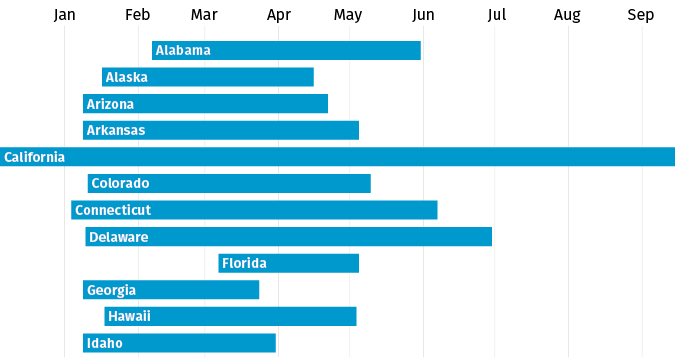
Span charts, also known as floating bar graphs, or difference graphs, illustrate the range of a data set. Rather than focusing on a single value, these charts show the maximum and minimum values a data set takes within a given period. This information can be compared to other data sets within the same period, or across periods.