Stacked Area
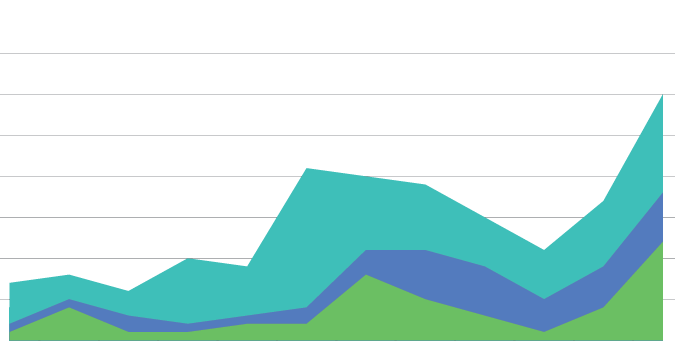
A stacked area graph is a modification of a simple area graph, with multiple data series plotted on top of each other. The second data series thus starts from the point left by the first, and so on. The area below each line is filled using a different color/texture to make the chart easy to read. The chart is also similar to stacked bar charts, as both show subcategories adding up to a total. A stacked area graph would be effective to compare multiple variables over time, particularly if they are related. A variation of the stacked area chart is the 100% stacked area chart, which focuses on how the percentage of each subcategory to the whole varies over time.