Stream Graph
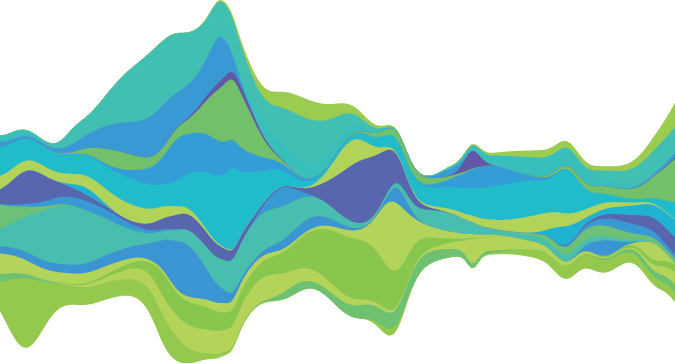
A stream graph, also known as a theme river, is a modification of the stacked area graph. Rather than plotting values against a fixed, straight axis, the values are displaced along a central baseline. The final output thus resembles a flowing river. The axis parallel to the "stream" indicates time (can be daily, monthly, yearly, etc.), while the height of the area indicates value. Different colors/textures can be used to represent multiple data sets on a single graph, making it easy to compare trends. Stream graphs can be used to visualize the quantity changing within categories over time with the area of each indicating the variability. Stream graphs can help identify patterns and seasonality.