Tree Map
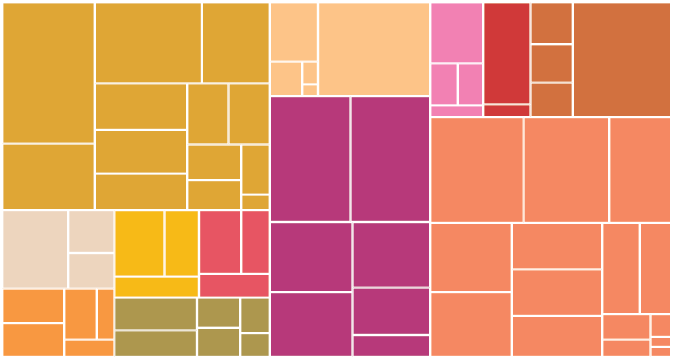
Tree maps are a variation of a tree diagram, used to represent hierarchy. The tree map represents hierarchal structure, while using the size or area of the squares to represent quantity. Each category is assigned a rectangle, with subcategories displayed inside the large rectangle, in proportionate size against each other. The area of the parent category is thus a sum of its sub-categories, with a clear part-to-whole relationship displayed. No connecting lines or branches are required, as in the case of a tree diagram. The shapes within the tree map are created using coding algorithms, and thus need special software. A tree map can be used to illustrate relative expenditures within a budget, with the area of the squares representing number of amounts allocated to each budget category.
Image source: Mike Bostock